February 21, 2024
Optical Coherence Tomography (OCT) has improved our ability to diagnose and monitor glaucoma, elevating optometrists’ diagnostic acumen to near that of a specialist. For example, subtle changes to the retinal nerve fiber layer (RNFL) can be readily appreciated, something that was previously difficult to do. OCT was introduced by Carl Zeiss Meditec, Inc. in the early 2000s with the Stratus, a time-domain device that changed how the optic nerve, macula, and RNFL were evaluated.1 The Stratus had limitations due to its relatively slow scan speed (100 scans per second) but nonetheless was a technological breakthrough.1,2
In 2007, Optovue (Visionix, Inc.) introduced the first spectral domain OCT in the United States with several companies soon following.2 Spectral Domain OCTs had scan speeds increased to 27,000 scans per second with improved performance.3 Over the next decade, OCTs continued to improve, with several devices having scan speeds approaching 100,000 scans per second. Still, improvements went from enhancements to incremental changes as spectral domain aged. While artificial intelligence will lead to further advances, a recent innovation, RNFL Optical Texture Analysis (ROTA), has the potential for significant diagnostic improvements.4
ROTA’s Role in Early Detection of Glaucoma
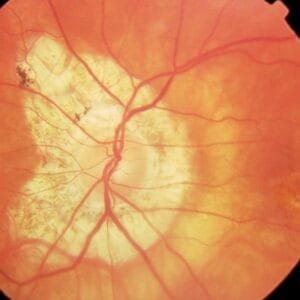
Retinal nerve fibers, which are the ganglion cell axons, are found in bundles within the retina’s nerve fiber layer and have a characteristic pattern and appearance as they appear to arc toward the optic nerve. RNFL assessment has been an important part of glaucomatous evaluation, with loss being an early sign of damage. As the RNFL is lost, the underlying retinal pigment epithelium is exposed, leading to dark slits or wedges appearing within the retina.
RNFL loss occurs in a pattern, most commonly visible in the inferior temporal and superior temporal poles in an arc-like shape emanating from the optic nerve. RNFL defects start as slits and often coalesce or widen to form wedge-like defects.
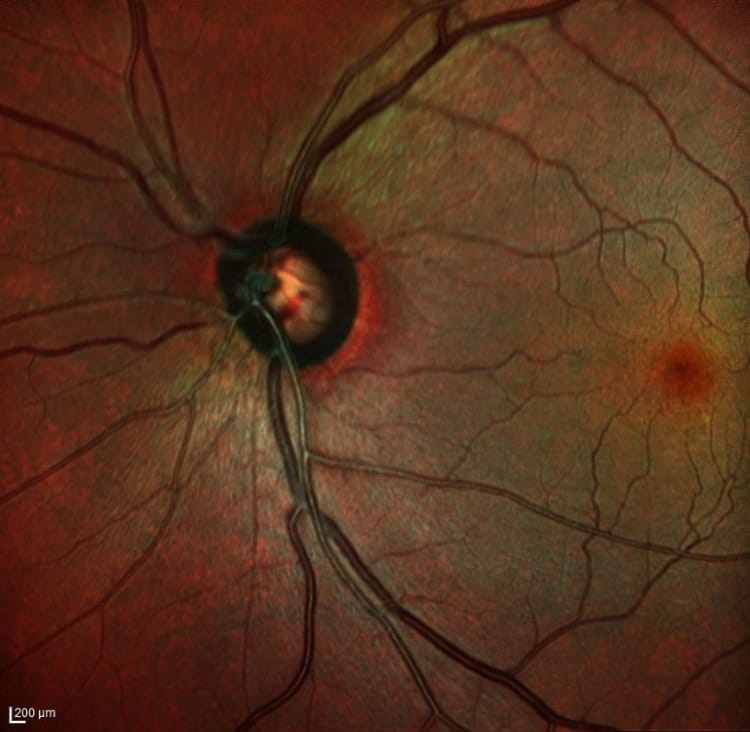
In direct examination, RNFL loss is most obvious in a dark fundus and less apparent in lighter pigmented fundi. When media opacities are present or if the RNFL loss has progressed to a diffuse fashion, recognition of defects is difficult. The sensitivity and specificity for the OCT to detect early defects ranges from 65% to 75% with a specificity of 90% to 95%.5,6 Reasons why the sensitivity is not higher are complex and in part relate to variations in RNFL distribution. ROTA was developed to improve the OCT’s ability to detect RNFL loss.7
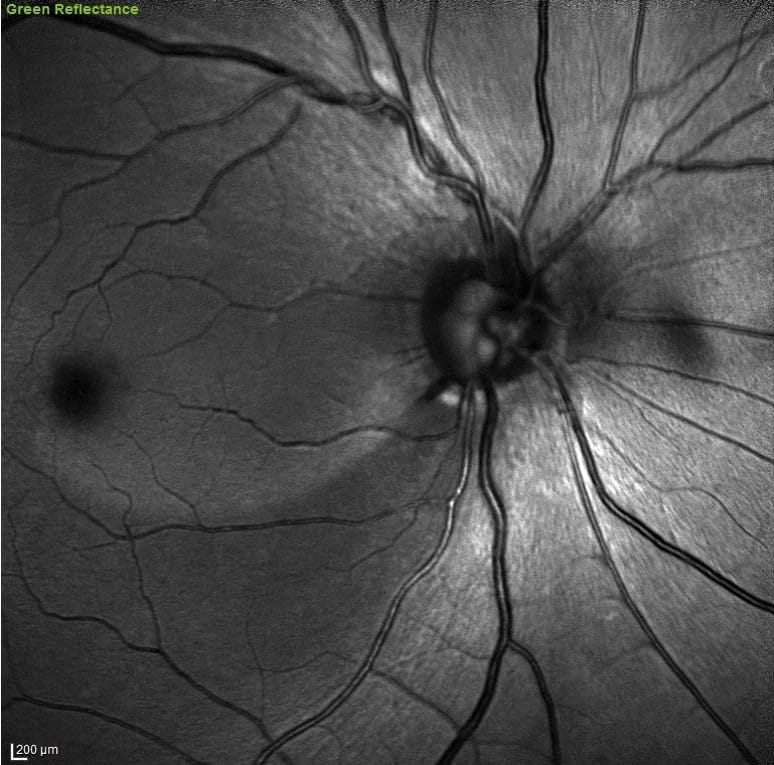
The retinal nerve fibers have a sheen and texture that is readily apparent in heathy eyes. Dr. Juhani Airaksinen and Dr. Harry Quigley both described techniques to assess the RNFL as part of the glaucoma evaluation.8,9 While the RNFL can be assessed in real time using a slit lamp and fundus lens, it more typically involves evaluating red-free photographs. The GDx Retinal Nerve Fiber Layer Analyzer (Carl Zeiss Meditec, Inc.) was developed in the early ’90s to evaluate RNFL thickness.2 Retinal polarization was measured with a thicker RNFL showing increased retardation, the retardation measurements were translated into RNFL thickness values.
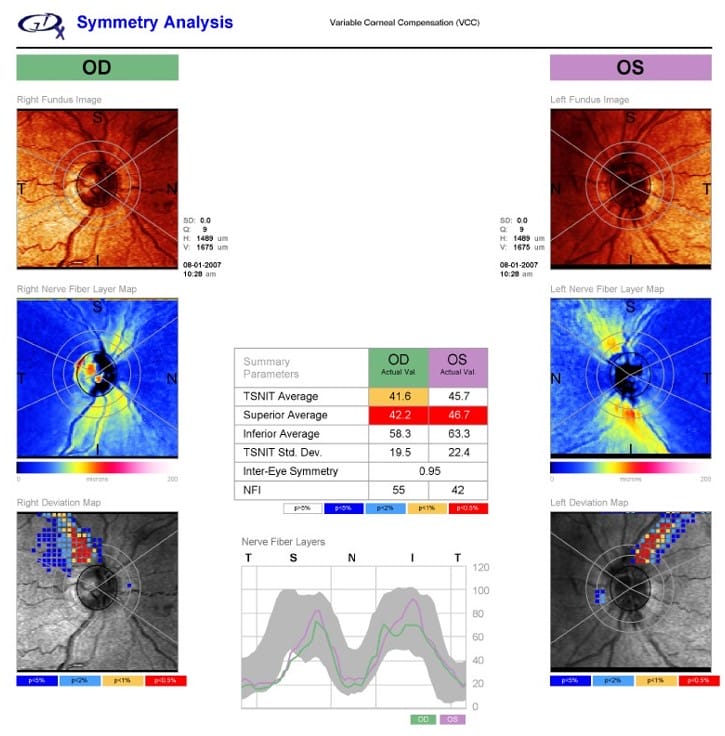
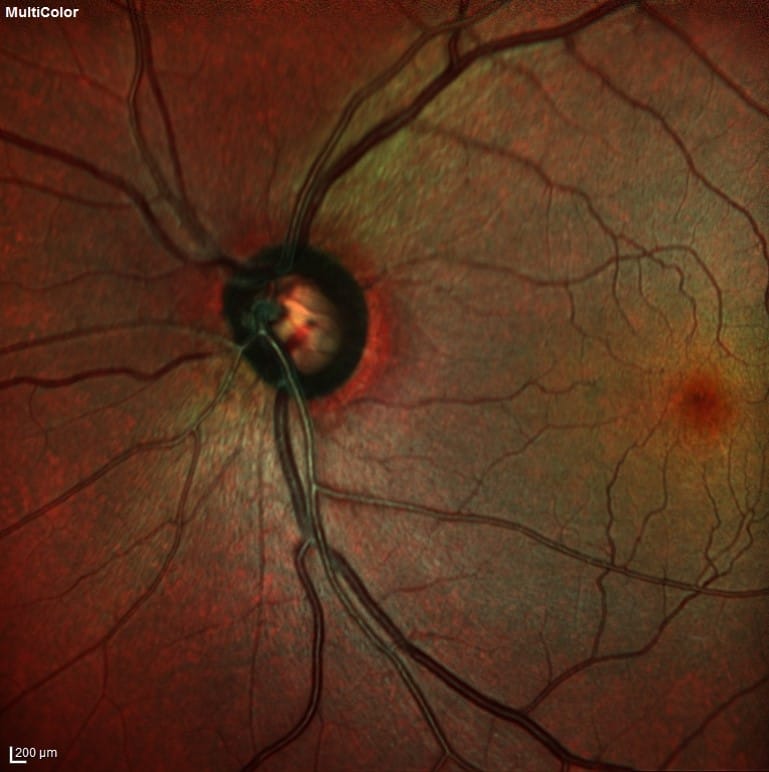
The introduction of the OCT, which measures the circumpapillary RNFL, led to a decline in the GDx’s popularity. OCT RNFL measurements are evaluated using a normative or reference database to illustrate how a value compares to a statistically normal population.8 The color-coded values signify if a finding is within the normal range, borderline, or abnormal (less than that found in 1% of healthy individuals). Normative databases have a host of issues, such as who is included, and they limit how effective the device performs in recognizing early disease or even differentiating those that are free from disease.10 ROTA utilizes a qualitative assessment of the images, and its analysis is performed without using normative data.7 ROTA uses an algorithm that integrates RNFL thickness with RNFL reflectance data. By including these two dimensions of data within each individual OCT B-scan and across multiple scans that comprise an OCT volume scan, it leads to RNFL optical texture signature values that are transformed into a single image. This image spans the entire region of the respective OCT volume scan (such as a 12 x 9 mm scan pattern).
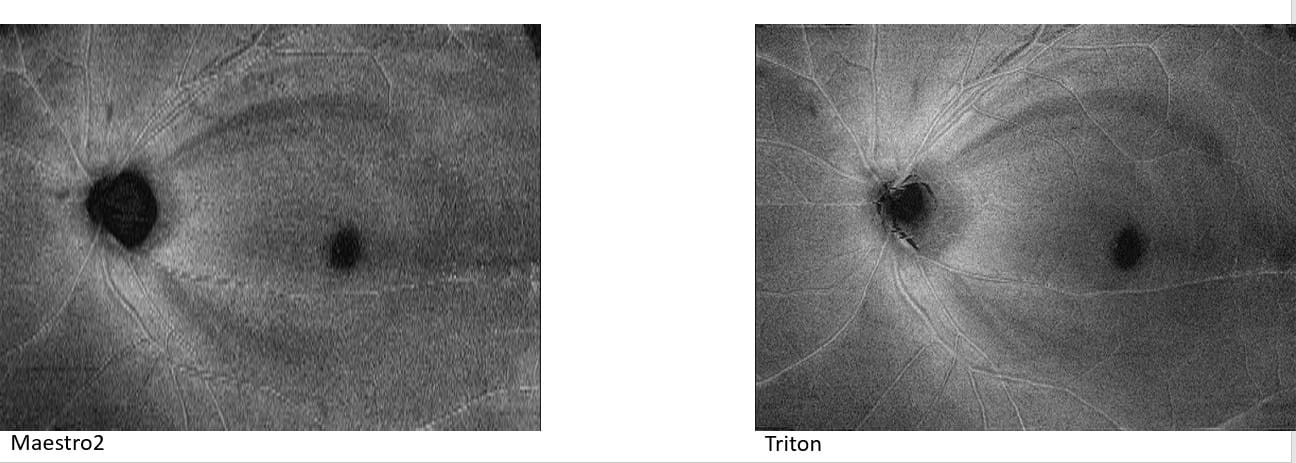
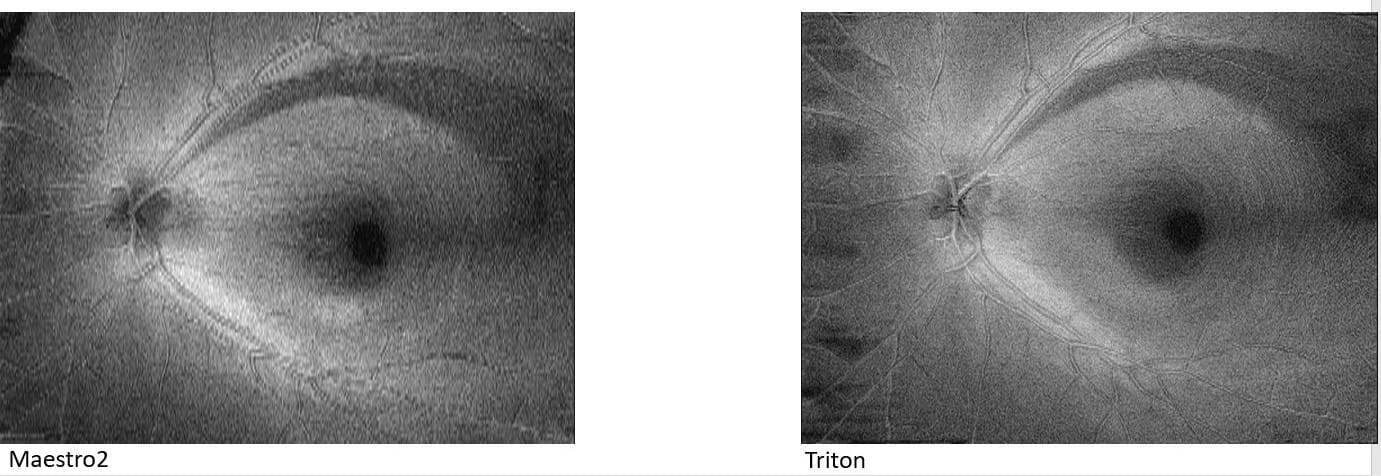
Figure 4A. These are ROTA images from a patient with early primary open angle glaucoma, taken with a Topcon Maestro 2 OCT (left side) and Topcon Triton OCT (right side). In these images from a left eye, RNFL defects are seen at 1 o’clock and 5 o’clock extending from the optic disc into the periphery. Multiple RNFL defects are seen superior and inferiorly, which will coalesce into a large wedge defect.
Photos courtesy of Chris Leung, MD and Topcon, Inc.
Its analysis complements (not replaces) other pieces of OCT information. It is not an infrared image nor created from a fundus image. ROTA allows the recognition of RNFL bundle defects that would often not be discernible using traditional photography, red-free photography, or OCT analysis.7,11 ROTA can also be useful in differentiating glaucomatous from non-glaucomatous retinopathies.7
ROTA has improved our understanding of how glaucoma presents. Leung et al. applied ROTA analysis in eyes with early glaucoma and showed that 71.6% and 17.2% showed RNFL defects that involved the papillomacula and papillovoeal regions, with only 25% showing arcuate bundle defects without macula or fovea involvement.12 The pattern of RNFL defects varied greatly, with the most common defect (20.6%) being an inferior arcuate and inferior papillomacular bundle defect.12 These results illustrate that the macula region is involved early as glaucoma develops. Kai-Ying Su and colleagues applied ROTA analysis in patients with ocular hypertension (OHTN) with healthy optic nerves (as seen by clinical and OCT examination) and full visual fields.11 Of the 306 enrolled patients, 10.8% showed RNFL defects in at least one eye, which would indicate that they have early or mild glaucoma, not OHTN. And with ROTA, papillomacula defects are often apparent, something we once thought was rare.12 This again illustrates that the macula area is involved in the initial stages of glaucoma development.
ROTA holds the potential to improve our ability to detect early glaucomatous damage and is used with conventional OCTs, both spectral domain and swept source. ROTA will be combined with artificial intelligence soon, and that should further improve its performance, allowing small defects to be detected as glaucoma commences. Several companies have licensed the ROTA technology, and it is possible that clinicians may be using this technology in the next 12 to 18 months.
References
1 Hougaard JL, Heijl A. Glaucoma detection by the Stratus OCT. J Glaucoma 2007; 16(3):302-306.
2 Medeiros FA, Zangwill LM, Bowd C, et al. Comparison of GDx VCC scanning laser polarimeter, HRT II confocal scanning laser ophthalmoscope and stratus OCT optical coherence tomography for detection of glaucoma. Arch Ophthalmol 2004; 122:827-834.
3 Park SB, Sung KR, Kim KR, et al. Comparison of glaucoma diagnostic capabilities of Cirrus HD and Stratus optical coherence tomography. Arch Ophthalmol 2009;127:603-610.
4 Leung CK. Retinal nerve fiber layer (RNFL) optical texture analysis (ROTA) for evaluation of RNFL abnormalities in glaucoma. Invest Ophthalm Vis Sci 2018;59 (9):3497.
5 Leung CK, Cheung CY, Weinreb RN, et al. Retinal nerve fiber layer imaging with spectral-domain optical coherence tomography: a variability and diagnostic performance study. Ophthalmology 2009;116(7):1257-1263.
6 Oddone F, Lucenteforte E, Michelessi M, et al. Macula versus retinal nerve fiber layer parameters for diagnosing manifest glaucoma: a systematic review of diagnostic accuracy studies. Ophthalmolgy 2016; 123(5)939-949.
7 Leung CK, Lam AKN, Weinreb RN, et al. Diagnostic assessment of glaucoma and non-glaucomatous optic neuropathies via optical texture analysis of the retinal nerve fibre layer. Nat Biomed Eng 2022:6(5):593-604.
8 Sommer A, Quigley HA, Robin AL, et al. Evaluation of nerve fiber layer assessment. Arch Ophthalmol 1984;102(12):1766-1771.
9 Teesalu P, Airaksinen PJ, Tuulonen A. Blue-on-yellow visual field and retinal nerve fiber layer in ocular hypertension and glaucoma. Ophthalmology 1998;105(11):2077-2081.
10 Rho S, Suny Y, Kang T, et al. Improvement of diagnostic performance regarding retinal nerve fiber layer defect using shifting of the normative database according to vessel position. Invest Ophthalmol Vis Sci 2014;55(8):5116-5124.
11 Kai-Ying Su C, Guo PY, Man PP, et al. Retinal nerve fiber layer optical texture analysis: detecting axonal fiber bundle defects in patients with ocular hypertension. Ophthalmology 130(10):1080-1089.
12 Leung CKS, Guo PY, Lam AKN. Retinal nerve fiber layer optical texture analysis: involvement of the papillomacular bundle and papillofoveal bundle in early glaucoma. Ophthalmology 2022;129(9): 1043-1055.